
You start your trading day trying to filter all the information of what happened the previous day. Then you start to feel overwhelmed with all the data that are out there and end up doing the same thing again and again. Well, this is not necessarily a bad thing. After all, discipline in trading is a cornerstone of success. However, sometimes, repeating these tasks can be time-consuming. Wouldn’t it be better to just receive an email to have a look, with your morning coffee?
In this article, I will show you how to automate this process. As an example, I will set up an email that I will be getting after the closure of a trading day with the stocks that have:
- reached their 52-week high and,
- crossover their 200-day simple moving average
Stocks universe
First things first, you should select the stocks that you are interested in scanning during this process. As always, the imports first.
import pandas as pd
import yfinance as yf
from sendemail import send_email
from jinja2 import Template
from datetime import datetime, timedelta

stocks = pd.read_csv('stocks_universe.csv')
stocks = stocks[(stocks['CapCategory'] == 'mega') | (stocks['sector'].isin(['Technology', 'Financial Services']))]
Begin by reading a CSV file named stocks_universe.csv into a pandas dataframe. In this case, we need the columns symbol, name, CapCategory, and sector. The reason is that I would like to filter the stocks that I am interested in from SP500, the highly capitalized stocks, and the ones from the Technology or Finance sector. I selected those because I am feeling more comfortable personally in these areas.
If you want to create a file, you can check my article on how to create a custom screener. I will be using this output from it, however, you can use any file that has the above-mentioned columns.
Scan the stocks
Now that we have a dataframe named “stocks”, we are going to iterate through it. Before that, we should define 3 lists and one dictionary which we will pass later on to the email. Also, we will set up the crossover sma days to 200.
errors = []
l_52w_high = []
crossover_sma = []
crossover_sma_days  = 200
data = {
    'crossover_sma_days ': crossover_sma_days ,}
We can start now by iterating through the dataframe. We do not want any possible unhandled errors to get in our way, so we will make sure that when retrieving data from Yahoo Finance if there is an error, we move on to the next one. Possible common errors can be a delisted symbol, a misspelling of the stock symbol, or practically anything that can go wrong (Merphy’s Law)…
# calculate the start date 2 years from now
current_date = datetime.now()
start_date = (current_date + timedelta(days=-2*365)).strftime("%Y-%m-%d")  # Approximate 2 years as 2 * 365 days

for index, row in stocks.iterrows():
    stock = row['symbol']

    try:
        df = yf.download(stock, start=start_date)['Adj Close'].to_frame()
        df.sort_values('Date', inplace=True, ascending=True)
        df['pct_change'] = df['Adj Close'].pct_change()

        # 52-week high calculation
        df['52W_high'] = df['Adj Close'].rolling(window=252).max()
        df['52W_high'] = df['52W_high'] == df['Adj Close']
        # calculate how many highs last month
        df['52W_high_count'] = df['52W_high'].rolling(window=22).sum()
        if df['52W_high'].iloc[-1]:
            l_52w_high.append({'ticker': stock,
                               'name': row['shortName'],
                               'sector_industry': f'{row["sector"]} / {row["industry"]}',
                               'cap': row['CapCategory'],
                               'close': round(df['Adj Close'].iloc[-1], 2),
                               'pct_change': round(df['pct_change'].iloc[-1] * 100, 2),
                               'last_month_52highs': df['52W_high_count'].iloc[-1]})

        # crossover_sma
        sma_col = "sma_" + str(crossover_sma_days)
        df[sma_col] = df['Adj Close'].rolling(window=crossover_sma_days).mean()
        if df['Adj Close'].iloc[-1] > df[sma_col].iloc[-1] and df['Adj Close'].iloc[-2] < df[sma_col].iloc[-2]:
            crossover_sma.append({'ticker': stock,
                                  'name': row['shortName'],
                                  'sector_industry': f'{row["sector"]} / {row["industry"]}',
                                  'cap': row['CapCategory'],
                                  'close': round(df['Adj Close'].iloc[-1], 2),
                                  'pct_change': round(df['pct_change'].iloc[-1] * 100, 2)})

    except Exception as e:
        errors.append({'stock': stock, 'error': str(e)})
Also, it will be good to present in the email some info on SP500 which we will get with the below code:
# get sp500 data
try:
    df = yf.download('^GSPC', start=start_date)['Adj Close'].to_frame()
    df.sort_values('Date', inplace=True, ascending=True)
    df['pct_change'] = df['Adj Close'].pct_change()
    data['sp500'] = round(df['Adj Close'].iloc[-1],2)
    data['sp_pct_change'] = round(df['pct_change'].iloc[-1]*100, 2)
except:
    errors.append('Could not get SP500 data')
👉 If you’re automating stock alerts via email, making them clear and easy to manage is key. With Notify, you can design, customize, and send stock reports using an intuitive template builder — no need to deal with HTML or SMTP setup. It also comes with an easy-to-use API that integrates seamlessly with any tech stack, plus built-in analytics to track performance effortlessly.
Create the email body
Now we have the 3 lists and some data that we are going to pass to a jinja2 template
with open('email_template.html', 'r') as file:
    html_template = file.read()
template = Template(html_template)
html_output = template.render(data_52w_high=l_52w_high, data_crossover=crossover_sma, errors=errors, data=data)

send_email("Daily Stocks Email", html_output)
The template of the email should be stored as email_template.html using the below template. Some points that deserve your attention:
- if else structure to format green or red the daily percentage change
- if else structure to show the table of the stocks or a note that no stocks were found
- the URL of the stock to yahoo finance. From your mobile, it will open the Yahoo finance app.
<html>
<body>
<h2><a href="https://finance.yahoo.com/quote/%5EGSPC?p=%5EGSPC">S&P 500</a> {{ data.sp500 }}
    {% if data.sp_pct_change > 0 %}
        (<span style="color: green;">+{{ data.sp_pct_change }}%</span>)
    {% else %}
        (<span style="color: red;">{{ data.sp_pct_change }}%</span>)
    {% endif %}
</h2>
<h2>52-week high</h2>
{% if data_52w_high|length > 0 %}
<table border="1">
    <thead>
        <tr>
            <th>Ticker</th>
            <th>Name</th>
            <th>Sector/Industry</th>
            <th>Capitalization</th>
            <th>Current Price</th>
            <th>Change</th>
            <th>52w High last month</th>
        </tr>
    </thead>
    <tbody>
        {% for stock in data_52w_high %}
        <tr>
            <td><a href="https://finance.yahoo.com/quote/{{ stock.ticker }}">{{ stock.ticker }}</a></td>
            <td>{{ stock.name }}</td>
            <td>{{ stock.sector_industry }}</td>
            <td>{{ stock.cap }}</td>
            <td>{{ stock.close }}</td>
            <td>{{ stock.pct_change }}%</td>
            <td>{{ stock.last_month_52highs|int }} </td>
        </tr>
        {% endfor %}
    </tbody>
</table>
{% else %}
    <p>No stocks found.</p>
{% endif %}

<h2>Cross Over Moving Average {{ data.crossover_sma_days }}</h2>
{% if data_crossover|length > 0 %}
<table border="1">
    <thead>
        <tr>
            <th>Ticker</th>
            <th>Name</th>
            <th>Sector/Industry</th>
            <th>Capitalization</th>
            <th>Current Price</th>
            <th>Change</th>
        </tr>
    </thead>
    <tbody>
        {% for stock in data_crossover %}
        <tr>
            <td><a href="https://finance.yahoo.com/quote/{{ stock.ticker }}">{{ stock.ticker }}</a></td>
            <td>{{ stock.name }}</td>
            <td>{{ stock.sector_industry }}</td>
            <td>{{ stock.cap }}</td>
            <td>{{ stock.close }}</td>
            <td>{{ stock.pct_change }}%</td>
        </tr>
        {% endfor %}
    </tbody>
</table>
{% else %}
    <p>No stocks found.</p>
{% endif %}

{% if errors|length > 0 %}
<h3>There were errors in the following stocks</h3>
<p>
    {% for error in errors %}
    {{ error.stock }} - {{ error.error }} <br />
    {% endfor %}
</p>
{% endif %}

</body>
</html>
Automate the email
As a last step, you should automate the email using the GitHub Actions. You can get all the information needed in a past article of mine.
A simple guide to automate a Python script using GitHub Actions for free
Do you want to automate some simple Python script but you don’t want to bother with complicated environment setup…
Note that the cron job in the yml file can be configured as ‘0 2 * * 2–6’ which means that it will run at 2 am UTC every day from Tuesday to Saturday to capture the previous day.
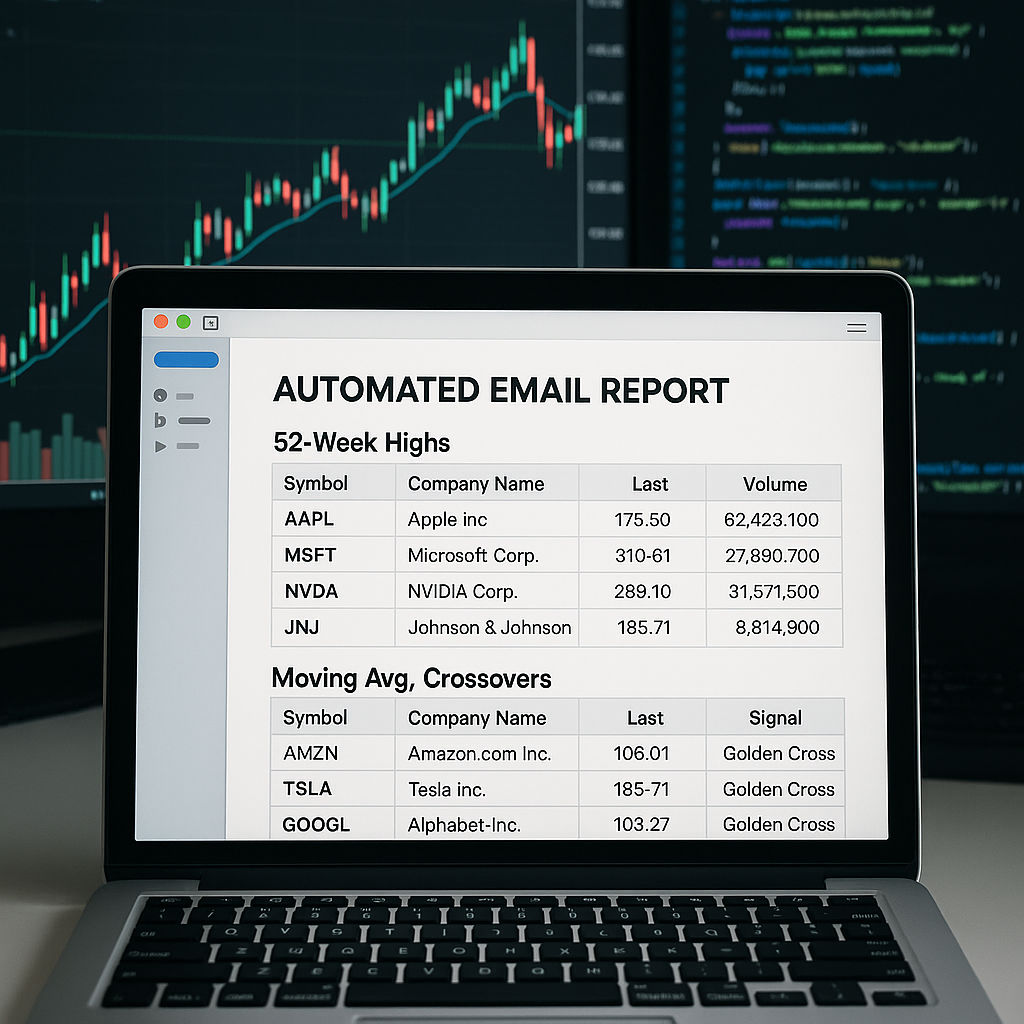
Final result
Now you have every day an email that looks like below:

Enjoy your coffee with it 😉
You can find the above code at GitHub https://github.com/phitzi/daily_market_report_medium