
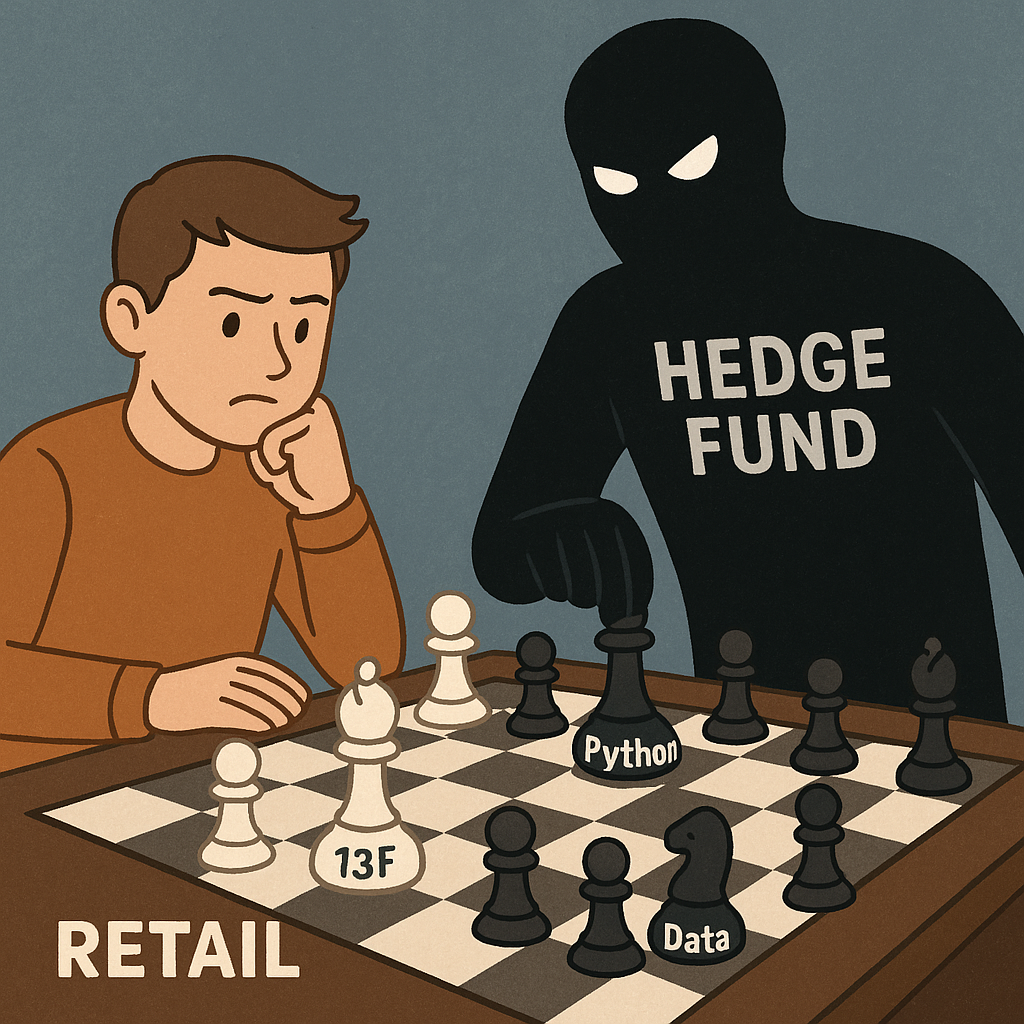
We, small traders, are always trying to find our edge on how to trade smartly with the limited resources that we have. On the other hand, there are hedge funds, with armies of traders, quants, developers, as well as the most important. Money and Data!
So how can we beat them? Well, we can’t… All we can do is follow them. But how?
Hedge funds are regulated entities and they are obliged to report quarterly to the Securities and Exchange Commission (SEC), a form called 13F. In this form, they include all of their equity holdings at the end of each quarter.
Where to find the 13F
SEC has a system called EDGAR (Electronic Data Gathering, Analysis, and Retrieval) where publicly traded companies (and not only) are uploading their corporate filings. Unfortunately, it is not the most user-friendly website of all.
As usual, everything is explained better with an example, and what is better than walking through Warren’s Buffet investments? His fund is called Berkshire Hathaway Inc.
First, you have to go to the company search page of the SEC website and search “Berkshire Hathaway”. This will bring you to a page with all the entities starting with this name. Make sure you select the one with the “Inc” at the end. You should be directed to the company’s filings.

Depending on the time you read this article, you might need to scroll down to find the form names 13F-HR. If you cannot find it, you can simply search for it by typing in the “Filing Type” textbox “13F”. Then just press the first one to see the latest. Note that you might see a filing 13F-HR/A. This is when a report has been amended (you should be able to see the initial one and the amended which is the valid one)

By now you should have arrived at the various docs and formats that you can view the report:
- primary_doc: is the document with information about the company and a summary in HTML and XML formats. Also here you will see a list of other managers for which the report is filed (usually companies of the same group)
- The information table is the actual report of the equity holdings for the reporting period again in HTML and XML format
- Finally, the txt file is the full submission file of the investor
At this point let’s focus on the HTML of the information table file:

Explaining 13F in details
Let’s see the columns one by one:
- Name of issuer: The issuer of the security.
- Title of class: Class of the security like common stock, put/call options, class A shares, convertible debenture (long-term debt which can be transformed into stock after a specific period)
- CUSIP: The CUSIP of the security. This is a unique number for each security. When aggregating results, this is your friend. You cannot expect all 13F forms to have spelled the name or title the same way.
- Value: The value in USD of the securities for the last day of the reporting period
- Shares owned: The number of shares owned for the last day of the reporting period and their type: “SH” for shares, “PRN” for principal amount, and Put/Call for options
- Investment discretion is for the nature of the investment: “SOLE” is when the reporting fund is the sole owner of the investment, “DFND” is share-defined (you can see in the next column the other managers that the investment is shared among), and “OTHER” when usually the investment is shared with other persons.
- Voting authority: the shares, separated into voting rights.
If you want to get into details you can read SEC’s official document for 13F filing here.
Some Python to parse the data
First things first, the imports
import requests
import pandas as pd
import xml.etree.ElementTree as ET
import matplotlib.pyplot as plt
import numpy as np

# this is to supress the scientific notation when we check on the data frames
pd.options.display.float_format = '{:20,.2f}'.format
Then we are going to get the 4 XML files for 2023 of Warren’s filed 13Fs. Note that you need to put the user agent in the headers, otherwise you get an interesting reply. Check it if you want 😉
user_agent = {'User-agent': 'Mozilla/5.0'}

cusip = '1067983'

Q423_url = f'https://www.sec.gov/Archives/edgar/data/{cusip}/000095012324002518/30197.xml'
Q423_responce = requests.get(Q423_url, headers=user_agent)

Q324_url = f'https://www.sec.gov/Archives/edgar/data/{cusip}/000095012323011029/28498.xml'
Q324_responce = requests.get(Q324_url, headers=user_agent)

Q223_url = f'https://www.sec.gov/Archives/edgar/data/{cusip}/000095012323008074/25376.xml'
Q223_responce = requests.get(Q223_url, headers=user_agent)

Q123_url = f'https://www.sec.gov/Archives/edgar/data/{cusip}/000095012323002585/20651.xml'
Q123_responce = requests.get(Q123_url, headers=user_agent)
We are going to create a function that will get the XML file and return a dataframe with all the holdings. At the end of the code below, we are storing the data in 4 different data frames:
def parse13f(xml):
    tree = ET.ElementTree(ET.fromstring(xml))
    root = tree.getroot()

    # Remove the namespace from all elements
    for elem in root.iter():
        # Check if element has a namespace
        if '}' in elem.tag:
            # Remove namespace prefix
            elem.tag = elem.tag.split('}')[1]
        else:
            # No namespace prefix found, keep the tag unchanged
            pass

    list_of_holdings = []

    # find all infoTable
    for infoTable in root.iter('infoTable'):
        holding = {}
        for c in infoTable.iter():
                if c.tag == 'nameOfIssuer':
                    holding['nameOfIssuer'] = c.text
                if c.tag == 'cusip':
                    holding['cusip'] = c.text
                if c.tag == 'value':
                    holding['value'] = c.text
                if c.tag == 'sshPrnamt':
                    holding['sharesAmount'] = c.text
        list_of_holdings.append(holding)

    df = pd.DataFrame(list_of_holdings)
    df['value'] = df['value'].astype(float)/1000
    df['sharesAmount'] = df['sharesAmount'].astype(float)/1000

    group_by = ['nameOfIssuer','cusip']
    df = df.groupby(group_by, as_index=False).sum()

    return df

dfQ423 = parse13f(Q423_responce.text)
dfQ324 = parse13f(Q324_responce.text)
dfQ223 = parse13f(Q223_responce.text)
dfQ123 = parse13f(Q123_responce.text)
Let’s see the first 10 investments of Warren:
df = dfQ423.copy().sort_values(by=['value'], ascending=False)
df = df.head(10)
plt.figure(figsize=(10, 6))
plt.bar(df["nameOfIssuer"], df["value"], color='blue')
plt.xlabel('Name of Issuer')
plt.ylabel('Value')
plt.title('Investments of the Fund')
plt.xticks(rotation=90)  # Rotate x-axis labels for better readability
plt.tight_layout()
plt.show()
As you can see, Warren is in love with Apple. So let’s plot in a pie chart his top 7 investments from last quarter. (I selected 7, because more will be very “choppy” on the chart).
df = dfQ423.copy().sort_values(by=['value'], ascending=False)

# Calculate threshold for smaller investments to be grouped
df_sorted = df.sort_values(by='value', ascending=False)
threshold = df_sorted.iloc[7]['value']

# Aggregate smaller investments into "Other"
df.loc[df["value"] < threshold, "nameOfIssuer"] = "Other"
df = df.groupby("nameOfIssuer").sum().reset_index()

# Plotting
plt.figure(figsize=(8, 8))
plt.pie(df["value"], labels=df["nameOfIssuer"], autopct='%1.1f%%', startangle=140)
plt.axis('equal')  # Equal aspect ratio ensures that pie is drawn as a circle
plt.title('Investments of the Fund')
plt.show()
Now, let’s compare between the quarters. I am going to create a dataframe that will have the shares, value, and percentage of investment compared to the whole portfolio for each quarter
list_of_dfs = [dfQ423, dfQ324, dfQ223, dfQ123]
list_of_suffixes = ['_Q423', '_Q324', '_Q223', '_Q123']

for i in range( len(list_of_dfs)):
    sum_of_portfolio = list_of_dfs[i]['value'].sum()
    list_of_dfs[i] = list_of_dfs[i][['nameOfIssuer', 'cusip', 'value', 'sharesAmount']]
    list_of_dfs[i]['inv_perc'] = (list_of_dfs[i]['value'] / sum_of_portfolio)*100

final_df = dfQ423.copy()

for i in range( len(list_of_dfs)):
    final_df = pd.merge(final_df, list_of_dfs[i], on=['nameOfIssuer', 'cusip'], how='outer', suffixes=(list_of_suffixes[i-1], list_of_suffixes[i]))

final_df
And let’s start analyzing the data. First I will plot the top 10 investments and their value amount in a grouped bar chart for each quarter
df = final_df.copy().sort_values(by=['value'], ascending=False)

# Calculate threshold for smaller investments to be gr
df = df.sort_values(by='value_Q423', ascending=False).head(10)

categories = df['nameOfIssuer'].tolist()  # Categories
groups = ['Q423', 'Q324', 'Q223', 'Q123']  # Groups
values = {
    'Q423': df['value_Q423'].tolist(),
    'Q324': df['value_Q324'].tolist(),
    'Q223': df['value_Q223'].tolist(),
    'Q123': df['value_Q123'].tolist()  # Values for Group 1
}

# Define the width of the bars
bar_width = 0.2

# Set the positions for the bars
x = np.arange(len(categories))

# Plotting the grouped bars
fig, ax = plt.subplots()
for i, group in enumerate(groups):
    positions = x + (i - (len(groups) - 1) / 2) * bar_width
    ax.bar(positions, values[group], bar_width, label=group)

# Add labels and title
ax.set_xlabel('Investments')
ax.set_ylabel('Value in billions')
ax.set_title('Top 10 Fund\'s Investments')
ax.set_xticks(x)
ax.set_xticklabels(categories)
ax.legend()
plt.xticks(rotation=90)  # Rotate x-axis labels for better readability
# Show plot
plt.tight_layout()
plt.show()
Warren is known for his ‘value investing’ strategy. This means that he buys stocks that seem to be undervalued and sells them years later when they achieve their deserved market value. And from the chart above it looks like he is a holder (not a typo).
A Hodler in the cryptocurrency world refers to an individual who holds onto their digital assets for the long term, regardless of market volatility
One more thing that we can (should) check, is the changes in absolute shares, that happened during 2023.
# sort the df, so we can get the changes of major investments sorted by significance
df = final_df.copy().sort_values(by=['value_Q423'], ascending=False)

# Specify the columns you want to check for differences
columns_to_check = ['sharesAmount_Q423', 'sharesAmount_Q324', 'sharesAmount_Q223', 'sharesAmount_Q123']

# Filter rows with differences between specific columns
filtered_df = df[df[columns_to_check].apply(lambda x: x.nunique(), axis=1) > 1]
filtered_df[['nameOfIssuer'] + columns_to_check]
If we inspect the table, we will see that there are no major changes at the top. More noticeably we can see:
- A significant increase in HP in the year (from 20K stocks to 120K and back to 10K)
- Dumping Sirius XM Holdings at the beginning of the year, but re-investing back
- Some small investment to Markel Corp and selling it off before the year ended.
The analysis can go on and on, but this story is to cover the basics and to be used as food for thought. You can find the code above on GitHub here.
What to check
The most important thing that you should check using the 13F is the changes in their portfolios. I parse a lot of funds and try to find (individually and aggregated):
- the major buys
- the major sells
- investments that even though there was a significant price change, the fund is still holding onto it
As an additional step, especially for the buys, I check also the 13D filing where I see the intentions of the fund and especially the “purpose of the transaction”. For example, if you want to know if the investor is just investing, or is willing to participate in the management, this is were you will see that.
Some small letters
There are some things that you should always have in mind when you read the 13F form:
- Time lag — The investors are obliged to report 1,5 months after the last day of each quarter and usually they do that late. For example, a report for the 31st of December might be published on the 14th of February. This means that you are reading information 45 days old…
- Unreliable data — there is no systematic review of the data submitted. This means don’t believe everything you read especially for some of the smaller funds.
- Hedging — only long positions are reported, and in some cases, those are used as hedging for their short positions. So you might think that some manager is investing in some company, while in reality, he had a short position that he hedged.
Conclusion
Leveraging SEC’s 13F filings offers small traders valuable insights into the investment strategies of large investment firms. However, due to time lags and potential data inaccuracies, we should always do our investigation. 13F is a food for thought — and should not be used to copy trades.