
Data is the backbone of financial analysis, trading strategies, and decision-making in the financial markets. It allows traders and analysts to identify patterns, test hypotheses, and make informed predictions about future price movements. Access to historical market data is crucial for backtesting trading strategies, understanding market behaviour, and refining algorithms to improve performance.
It can be used for:
Backtesting Strategies: Simulating how a trading strategy would have performed in the past.
Statistical Analysis: Identifying trends, volatility, and correlations between assets.
Machine Learning Models: Training predictive models to forecast price movements or classify market conditions.
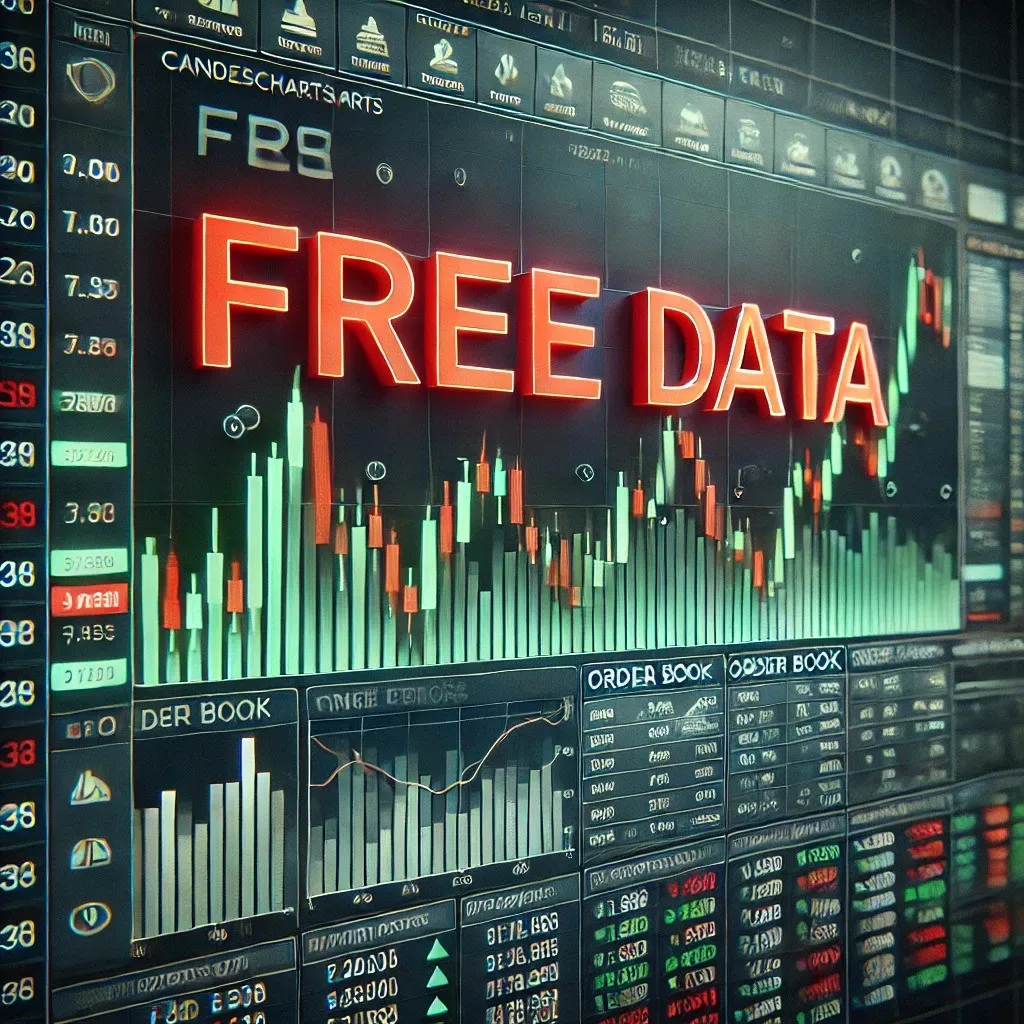
However, data are expensive to get, and for more cost-conscious users or users who just started and just want to see how this whole thing works, it is essential to know that there are solutions out there that can provide this data FOR FREE!
One of those solutions is Metatrader5, which allows you to download the candles in any timeframe for any instrument you want in a simple and understandable manner.
However, with Metatrader5, you can only get OHLC with Volume candles. This means NO fundamental data. For this type of data, I posted a guide some time ago about Yahoo Finance data.
101 Guide to yfinance in Python — Tons of data for free!
A cheat sheet on the free and popular open-source Python library yfinance to access financial data from Yahoo Finance.
But yFinance has limits with the history if you want to get timeframes that are less than daily. Hourly bars are limited to 730 calendar days, and smaller timeframes, up to 60 calendar days. Having data in timeframes of hours or even minutes is crucial for most of the strategies you will need to analyse and back-test and for sure more than the ones that yFinance offers.
What is MetaTrader 5
MetaTrader 5 (MT5) is a multi-asset trading platform widely adopted by brokers globally for trading forex, stocks, and commodities. Known for its advanced tools, algorithmic trading support, and strategy testing, MT5’s extensive market penetration makes it a go-to choice for traders seeking both manual and automated trading solutions. However, this article is not a demo for MT5, so we will scratch the surface of it and deep dive into how you can download data from it.
If you are familiar with MetaTrader5, the below are quite basic and I will re-use a lot of code from the official documentation. However, I felt like writing a 101 simple guide for those that are not familiar with MT5 (or want to keep it in their bookmarks) without having to go through the stip learning curve of such a platform and just want to get the data 😉
Get MetaTrader 5
To get MT5 installed in your environment, you need to visit https://www.metatrader5.com/en and download the software for your set-up (Windows, Mac or Linux)
At this point in time, I need to clarify that the data you will be getting with MT5 are coming from your broker. Don’t worry, though, if you don’t have one. There is a default broker for you named MetaQuotes Ltd., and as you have guessed from the name, yes, it is the same company that developed MT5.
Note: if you have already a broker supporting MT5, there is a good chance that they have their own version of MetaTrader 5 and you can to download it from their website.
This is not an article about how you can install MT5. There are plenty of those out there. I would assume that at the end, you will have a registered account like the one below in the tree of Accounts.

Download OHLC candles data manually.
First, you need to go to the menu View > Symbols and select the tab “Bars” (1)

Following that, you should select from (2)
- The instrument that you want the data for. Those are the instruments that your broker supports. From MetaQuotes, you will find a bunch of forex, equity, indexes and more.
- The timeframe is from 1 minute to a whole month
- The period for which you want to download the data for
- And finally, you will need to press the “Request” button to see the data on your screen.
To download the data, you simply need to press (3) the export bars.
However, there are some limits to how many candles you can download, and this is connected with the maximum number of candles that can be downloaded in a chart. To check how many candles you can download, you should go to the menu Tools > Options and check the setting “Max Bars in chart” at the tab “Charts”

When MT5 was installed at my PC, the default was 100K and I changed it to 10M. This way I was able to download the full history of EURUSD from 2006 which is for minute bars around 6 million candles.
Be careful! the limitations you should consider, are not the data that you can get, but actually the size of your hard disk and your processing power… The above data set was almost 0.4 GB. so apparently depending on your test case and your systems limitations, you should select the proper timeframe and amount of instruments.
Now, let’s have a quick look at this CSV. It is a tab-delimited formatted file with some “weird” column names as below…

From what I researched, there seems to be no way you can change the format of the download from MT5, so you should be able to leave with it…
To evaluate this dataset, you can easily import it into Excel (again, your system will limit you if you try an enormous amount of data). But if you are familiar with Python, you can use the below to load the file in a dataframe, create a single column with date time(as well as rename those ugly column names…)
import pandas as pd
df = pd.read_csv('EURUSD_M30_202108020000_202502060600.csv', delimiter='\t')
df.rename(columns={'<DATE>': 'date', '<TIME>': 'time', '<OPEN>': 'open', '<HIGH>': 'high', '<LOW>': 'low', '<CLOSE>':'close', '<TICKVOL>':'tick_volume', '<VOL>':'real_volume', '<SPREAD>': 'spread'}, inplace=True)
# Combine 'date' and 'time' columns into a single datetime column
df['time'] = pd.to_datetime(df['date'] + ' ' + df['time'])
# Set the new datetime column as the index
df.set_index('time', inplace=True)
# Drop the original 'date' and 'time' columns
df.drop(columns=['date'], inplace=True)
df
Download OHLC data with Python.
Now, let’s see how we can download data using Python. First, we need to install the MetaTrader5 python module from the terminal.
pip install MetaTrader5
Then we have to establish a connection with the platform
import MetaTrader5 as mt5
# display data on the MetaTrader 5 package
print("MetaTrader5 package author: ",mt5.__author__)
print("MetaTrader5 package version: ",mt5.__version__)

# establish MetaTrader 5 connection to a specified trading account
if not mt5.initialize(login=<your account login>, server="<your server>",password="<your password>"):
    print("initialize() failed, error code =",mt5.last_error())
    quit()
Running the above script will run MT5 (if it is not already running) and establish a connection to your preferred account (you should change the username, server and password in the above script).
The name of the instrument you would like to download is the name that you see on your MT5 Market Watch. However, if you want to explore which instruments are available for you, you can run the script below:
symbols=mt5.symbols_get()
print('Symbols: ', len(symbols))
print(type(symbols))

==================================
Symbols:  9787
<class 'tuple'>
This way, you will have a tuple (in my case, with MetaQuotes as a broker) of almost ten thousand instruments.
You can also get symbols filtered. For example, the script below will return all the symbols with “EUR” in their name.
filter = '*EUR*'
filtered_symbols=mt5.symbols_get(filter)
print(f'Filter {filter} returned: ', len(filtered_symbols))
print(", ".join(s.name for s in filtered_symbols))

=============================================

Filter *EUR* returned:  27
EURAUD, EURCAD, EURCHF, EURCNH, EURCZK, EURDKK, EURGBP, EURHKD, EURHUF,
EURILS, EURJPY, EURMXN, EURNOK, EURNZD, EURPLN, EURRUB, EURRUR, EURSEK,
EURSGD, EURTRY, EURUSD, EURZAR, XAUEUR, XAGEUR, EURL, IEUR, OEUR
To get the candles’ OHLC data, you can run the below code
import pytz
from datetime import datetime

# set time zone to UTC
timezone = pytz.timezone("Etc/UTC")
# create 'datetime' objects in UTC time zone to avoid the implementation of a local time zone offset
utc_from = datetime(2006, 1, 10, tzinfo=timezone)
utc_to = datetime(2025, 1, 11, hour = 13, tzinfo=timezone)
# get bars from USDJPY M5 within the interval of 2020.01.10 00:00 - 2020.01.11 13:00 in UTC time zone
rates = mt5.copy_rates_range("EURUSD", mt5.TIMEFRAME_M1, utc_from, utc_to)
if mt5.last_error()[0] != mt5.RES_S_OK:
    print(mt5.last_error())

print(f'Got {len(rates)} rates from {utc_from} to {utc_to}')

======================================================
Got 6937132 rates from 2006-01-10 00:00:00+00:00 to 2025-01-11 13:00:00+00:00
This way, we will get in a numpy.ndarray the rates (more than 6 million bars) from 2006 till today. Note here that if you input a date for which data are not supported, you will get an error.
In my case, I changed the date to 1990, and I got:
(-2, 'Terminal: Invalid params')
I know… it is not the most user-friendly error message, but it is what it is 😉
The rates can be easily converted to a dataframe for further processing.
import pandas as pd
# create DataFrame out of the obtained data
rates_frame = pd.DataFrame(rates)
# convert time in seconds into the 'datetime' format
rates_frame['time']=pd.to_datetime(rates_frame['time'], unit='s')
# rates_frame.dtypes
rates_frame
You will notice many prices ending in many decimals, which does not make sense. This is called the floating-point precision issue, a common problem with Python. Without getting into much detail why this happens, you can fix it with the code below.
float_columns = rates_frame.select_dtypes(include=['float64']).columns
rates_frame[float_columns] = rates_frame[float_columns].round(6)
rates_frame
Other timeframes
In the above examples, we downloaded the 1-minute timeframes. So let’s assume that, in our case, we would like also to work on other timeframes. The most obvious solution is to download again the data using a different timeframe with the mt5.copy_rates_range function and instead of using mt5.TIMEFRAME_M1, use the mt5.TIMEFRAME_H4, for example if we want the 4 hours candles.
But the performance of our script is of great significance, so there is another way to do it, assuming that you already have a smaller timeframe.
So in our example above, that we have the 1-minute candles and we also want the 4-hour ones, we can use the pandas powerful function called resample (full documentation here)
# Ensure the 'time' column is in datetime format
rates_frame['time'] = pd.to_datetime(rates_frame['time'])

# Set 'time' as the index
rates_frame.set_index('time', inplace=True)

# Resample to 4-hour frequency and aggregate appropriately
rates_frame_H4 = rates_frame.resample('4H').agg({
    'open': 'first',         # First value in the 4-hour period
    'high': 'max',           # Maximum value in the 4-hour period
    'low': 'min',            # Minimum value in the 4-hour period
    'close': 'last',         # Last value in the 4-hour period
    'tick_volume': 'sum',    # Sum of tick volumes over the period
    'spread': 'mean',        # Average spread over the period
    'real_volume': 'sum'     # Sum of real volumes over the period
})

# Reset the index to make it a regular DataFrame again
rates_frame_H4.reset_index(inplace=True)
rates_frame_H4
You will notice how easy it is to explain to the resample function that converting to 4H should get the first of the 1-min candles for the open, the max of the same for the high, the min for the low, etc. Amazing!
Also, you don’t have to worry about the incomplete candles. Resampling will use the exact 4-hour window starting from 00:00 to 04:00, etc
Please be aware, though, that the market is not open 24/7, so there might be candles that are not full.
What about ticks
In some more detailed strategies, you will need the OHLC data and the actual ticks. With MT5, you can get them both manually and the Python way, as we did above with the OHLC bars.

Again, the limit is the sky, depending on how much free space you have in your hard drive and your patience.
With Python, the code will be pretty similar to the bars. First, we will get the ticks.
from datetime import datetime
import pytz
# set time zone to UTC
timezone = pytz.timezone("Etc/UTC")
# create 'datetime' objects in UTC time zone to avoid the implementation of a local time zone offset
utc_from = datetime(2025, 1, 1, tzinfo=timezone)
utc_to = datetime(2025, 2, 7, tzinfo=timezone)
# request AUDUSD ticks within 11.01.2020 - 11.01.2020
ticks = mt5.copy_ticks_range("EURUSD", utc_from, utc_to, mt5.COPY_TICKS_ALL)
print("Ticks received:",len(ticks))

========================================
Ticks received: 1433475
And then convert them to a dataframe.
import pandas as pd
# create DataFrame out of the obtained data
ticks_frame = pd.DataFrame(ticks)
# convert time in seconds into the datetime format
ticks_frame['time']=pd.to_datetime(ticks_frame['time'], unit='s')
# fix the floating-point precision issue
float_columns = ticks_frame.select_dtypes(include=['float64']).columns
ticks_frame[float_columns] = ticks_frame[float_columns].round(6)
ticks_frame
Conclusions
- Access to historical market data is essential for financial analysis, trading strategy development, and machine learning applications, and MetaTrader 5 (MT5) offers a robust solution for acquiring such data.
- MT5 provides free access to OHLC and volume data across multiple instruments and timeframes, making it an excellent choice for cost-conscious users or beginners.
- While MT5 lacks fundamental data and has limitations like broker-dependent data quality and hard disk constraints, these issues can be mitigated with proper planning and supplementary tools like yFinance.
- Python integration with MT5 enables efficient automation, data transformation, and resampling, allowing users to handle large datasets effectively.
- By leveraging MT5’s capabilities alongside Python’s powerful libraries, traders and analysts can unlock significant opportunities for backtesting, statistical analysis, and predictive modelling.
For more information about what you can do with MT5 and Python, you can visit the official MetaTrader5 documentation here.
Thank you for reading